Corona-Stippling-Generator
This program collects different data sources of the covid-19-pandemic to present it in a stippling-visualisation. The generation of the plot is processed in two steps: At first, a chloropleth map is created from the raw data. In the second stage, out of the intensity values in the chloropleth images the stippling visualisation plots are generated.
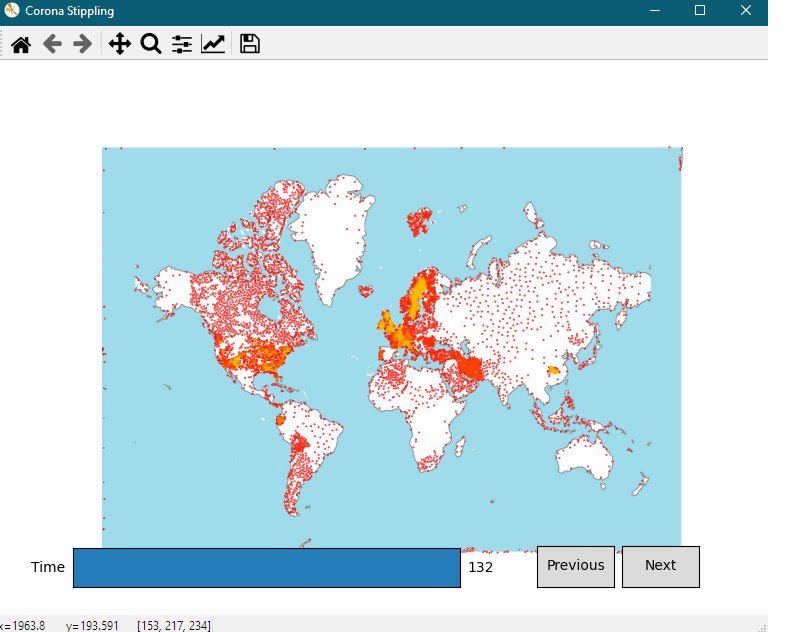
This is done for every day. In a GUI-program, the visualizations can be explored.
The GUI (StipplingGUI.py) is a simple Matplotlib interface with two buttons and a slider. Using the slider and/or the buttons, one can move through the visualization over time, which shows the development of the pandemic over the last months. The GUI supports zooming to get a better look at details and an overview for the zoomed-out image. Since we use raw data to ensure that the information doesn’t get lost regardless of zoom level, the GUI can be slow in changing between days.